View Logs
The Log page brings together events recorded by PVM and its connected products. Use it to investigate activity, identify errors, and trace an event, process, or user that generated it.
To open the page, select Log from the sidebar.
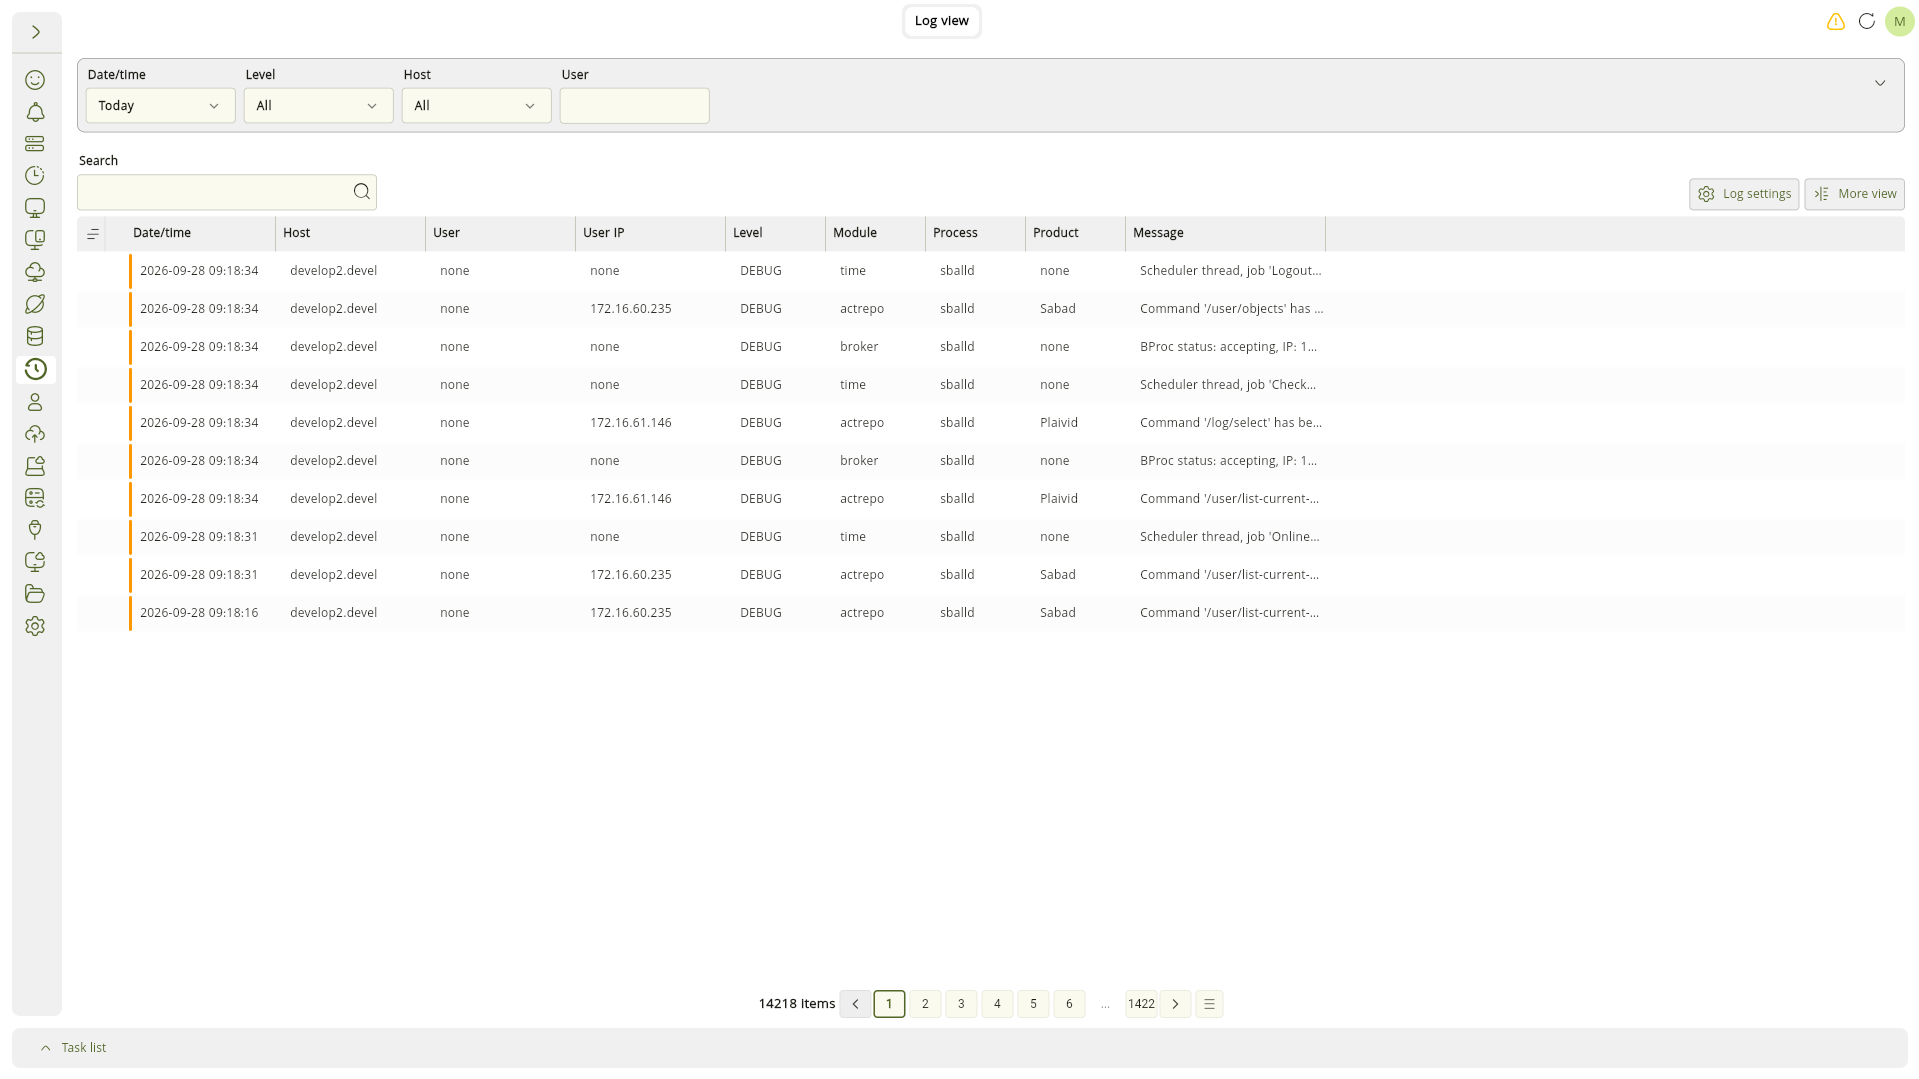
The newest entries appear first. The page refreshes automatically, so the number of available items can change while you are reviewing the list.
Filter the Log List
The filter panel appears above the table. The simple view contains the filters used most often.

-
Date/time: Limits results to All Time, Today, Yesterday, Last Week, or Last 2 Weeks. Select Custom to display
FromandTofields, then choose the start and end date and time. -
Level: Filters entries by severity. Available levels are Fatal, Alert, Error, Warning, Notice, Info, Debug, Verbose, and Trace. Select All to include every level.
-
Host: Shows entries from a particular host. Select All to include every host.
-
User: Shows entries associated with the entered username. The list updates shortly after you stop typing.
When using a custom range, the To value cannot be earlier than the From value.
Advanced Filters
Select the down arrow at the right side of the filter panel to display the advanced filters.

The advanced view adds these fields:
-
Module: Limits results to a PVM subsystem or service module.
-
Process: Filters by the name of the process that recorded the entry.
-
Product: Filters by the product associated with the entry.
-
User IP: Filters by the user's IPv4 address.
Select the up arrow to return to the simple filter view. Closing the advanced view clears Host, User, Module, Process, Product, and User IP, then reloads the list. The selected date/time range and level remain active.
Search Logs
Enter text in the Search field to narrow the current result set. Search works together with the filters, so you can first limit the time range, severity, or host and then search within those results.
To clear the search, remove the text from the field.
Read the Log Table
The compact table displays the first nine columns. Values shown as none were not recorded for that entry.
| Column | Description |
|---|---|
| Date/time | Date and time at which the event was recorded. |
| Host | Host on which the event occurred. |
| User | User associated with the event, when available. |
| User IP | IP address associated with the user or request, when available. |
| Level | Severity of the event. |
| Module | Plaivid module that generated the entry. |
| Process | Process or service that generated the entry. |
| Product | Product associated with the event. |
| Message | Recorded event message. |
Display More Columns
Select More view above the table to display the diagnostic columns in addition to the compact set.
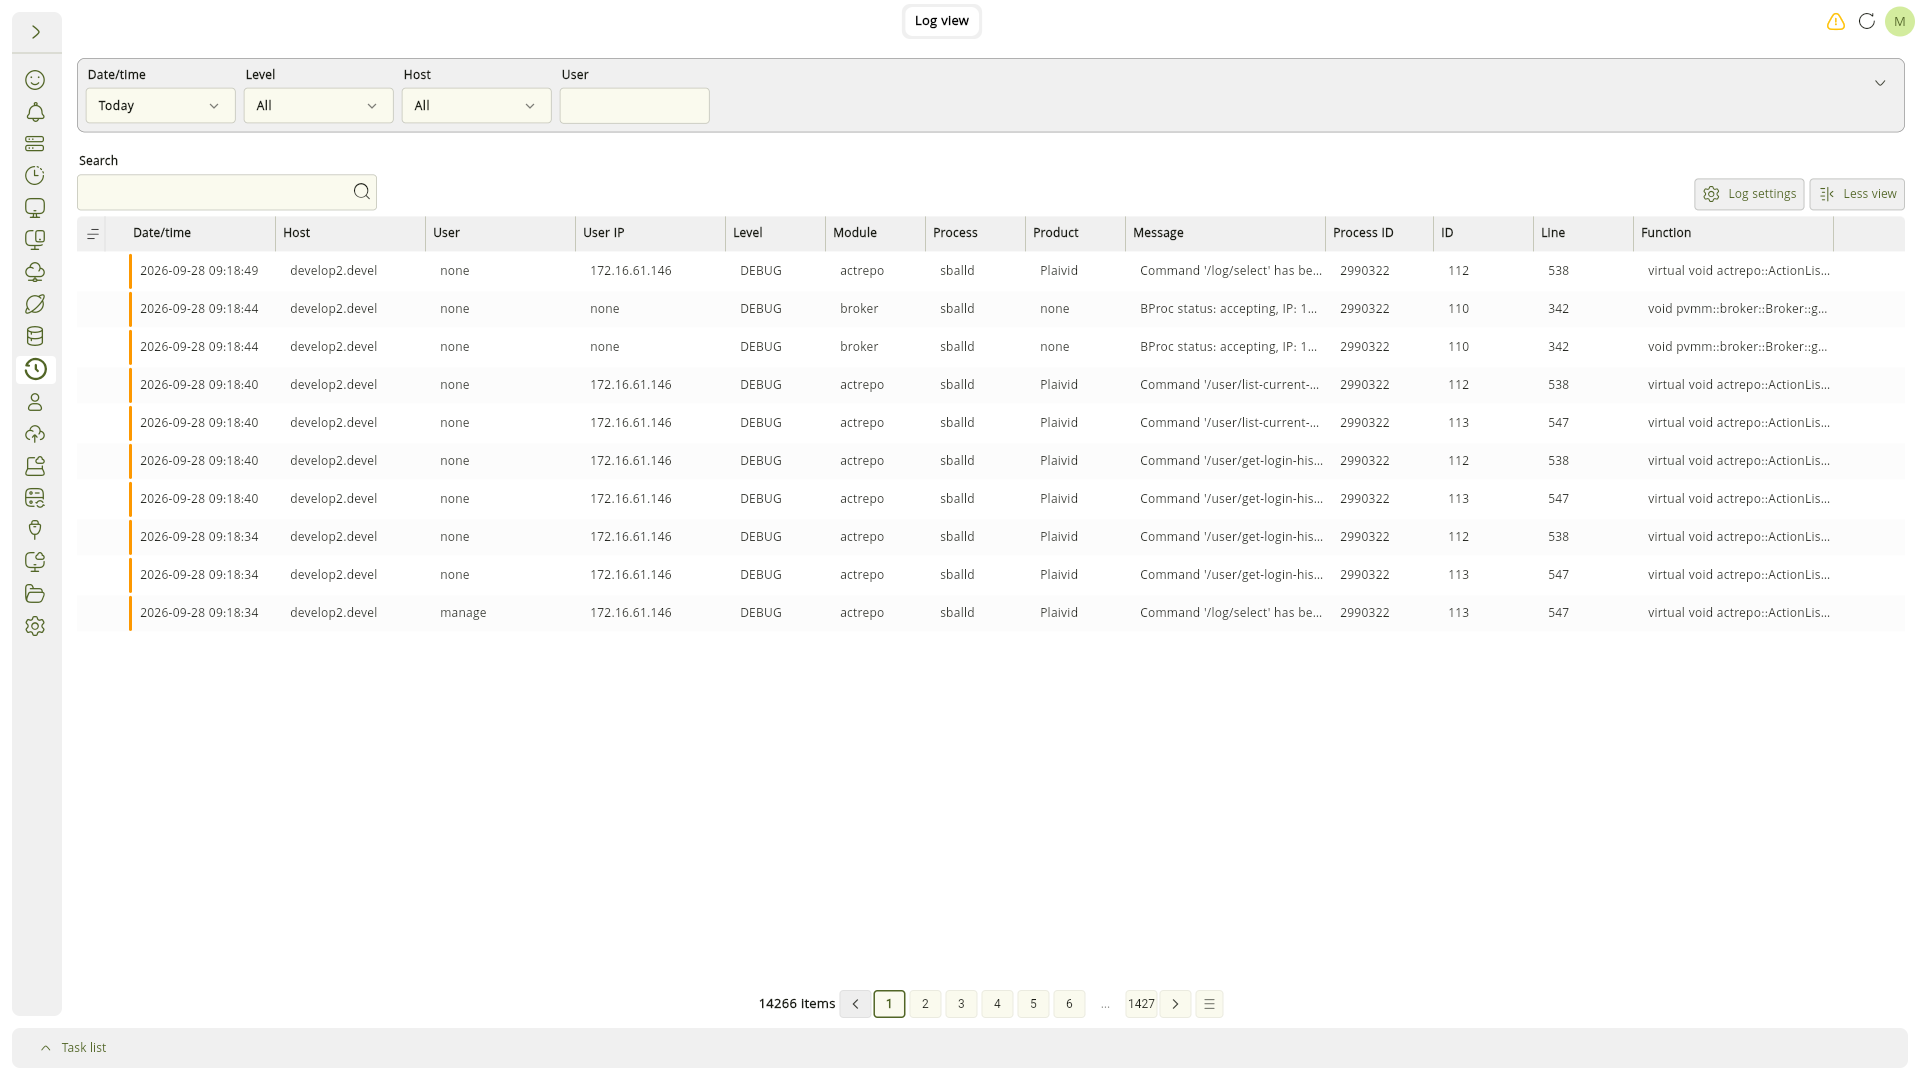
| Additional column | Description |
|---|---|
| Process ID | Operating-system identifier of the process that generated the entry. |
| ID | Identifier recorded for the log entry. |
| Line | Source-code line associated with the entry, when available. |
| Function | Function that generated the entry, when available. |
Select Less view to return to the compact table.
Move Between Pages
The bottom of the page shows the total number of matching items and the available page numbers. Select a page number or use the previous and next arrows to move through the results.
Open Log Settings
Select Log settings above the table to open the log configuration window. For details, see Log settings.