Ticket Dashboard Guide
The ticket dashboard provides a summary view of ticket counts, handling status, responsible units, and specialist performance.
Information on this page is calculated only based on tickets that the current user is allowed to view; therefore, the displayed numbers may not be the same for different users.
Opening the Ticket Dashboard
From the system menu, open Dashboard, and select the Tickets option at the top of the page.
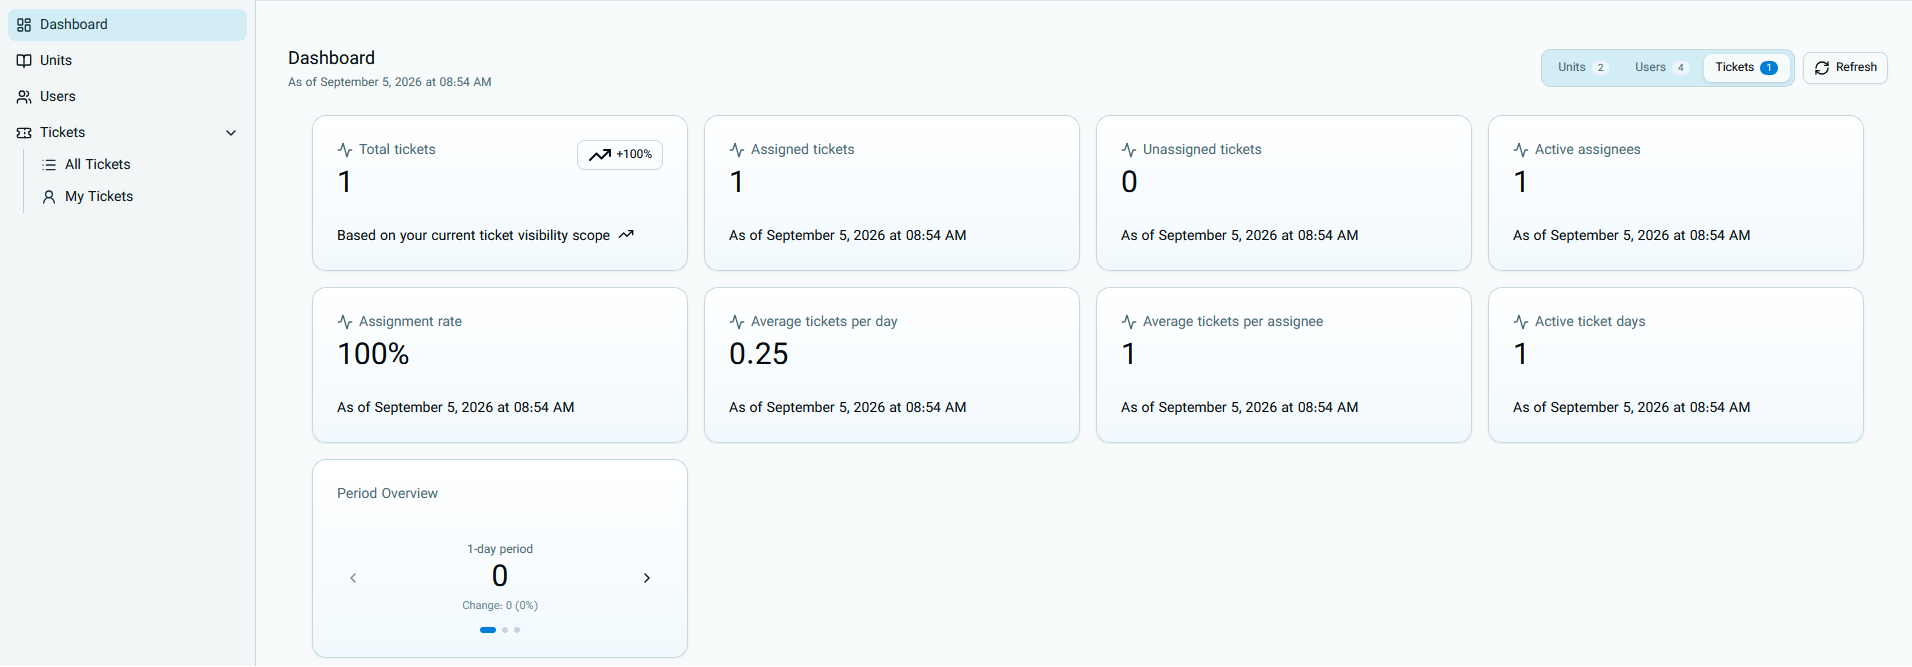
The number next to the Tickets option shows the number of tickets available within your access scope. You can use the Refresh button to fetch the latest statistics.
Main Ticket Metrics
| Metric | Meaning |
|---|---|
| Total tickets | Number of tickets created in the statistical period and within your access scope |
| Assigned tickets | Tickets for which a responsible specialist has been specified |
| Unassigned tickets | Tickets that have not yet been assigned to a specific specialist |
| Active specialists | Number of specialists who have at least one assigned ticket |
| Assigned ticket percentage | Share of tickets with a specialist out of all tickets |
| Average tickets per day | Average number of tickets registered in the calendar days of the period |
| Average tickets per specialist | Average number of tickets assigned to specialists who have tickets |
| Days with tickets | Number of days on which at least one ticket was registered |
For example, if there are 6 tickets and 4 of them have a specialist, the assigned ticket percentage will be approximately 66.7%, and 2 tickets will still remain unassigned.
Period View
The Period View card shows the number of tickets and their rate of change in the selected interval. Use the arrows on both sides of the card to move between available display periods.
The change number indicates whether the number of tickets has increased or decreased compared to the previous period. An increase is shown with a plus sign and a decrease with a minus sign.
Ticket Statistical Details
Tickets by Status
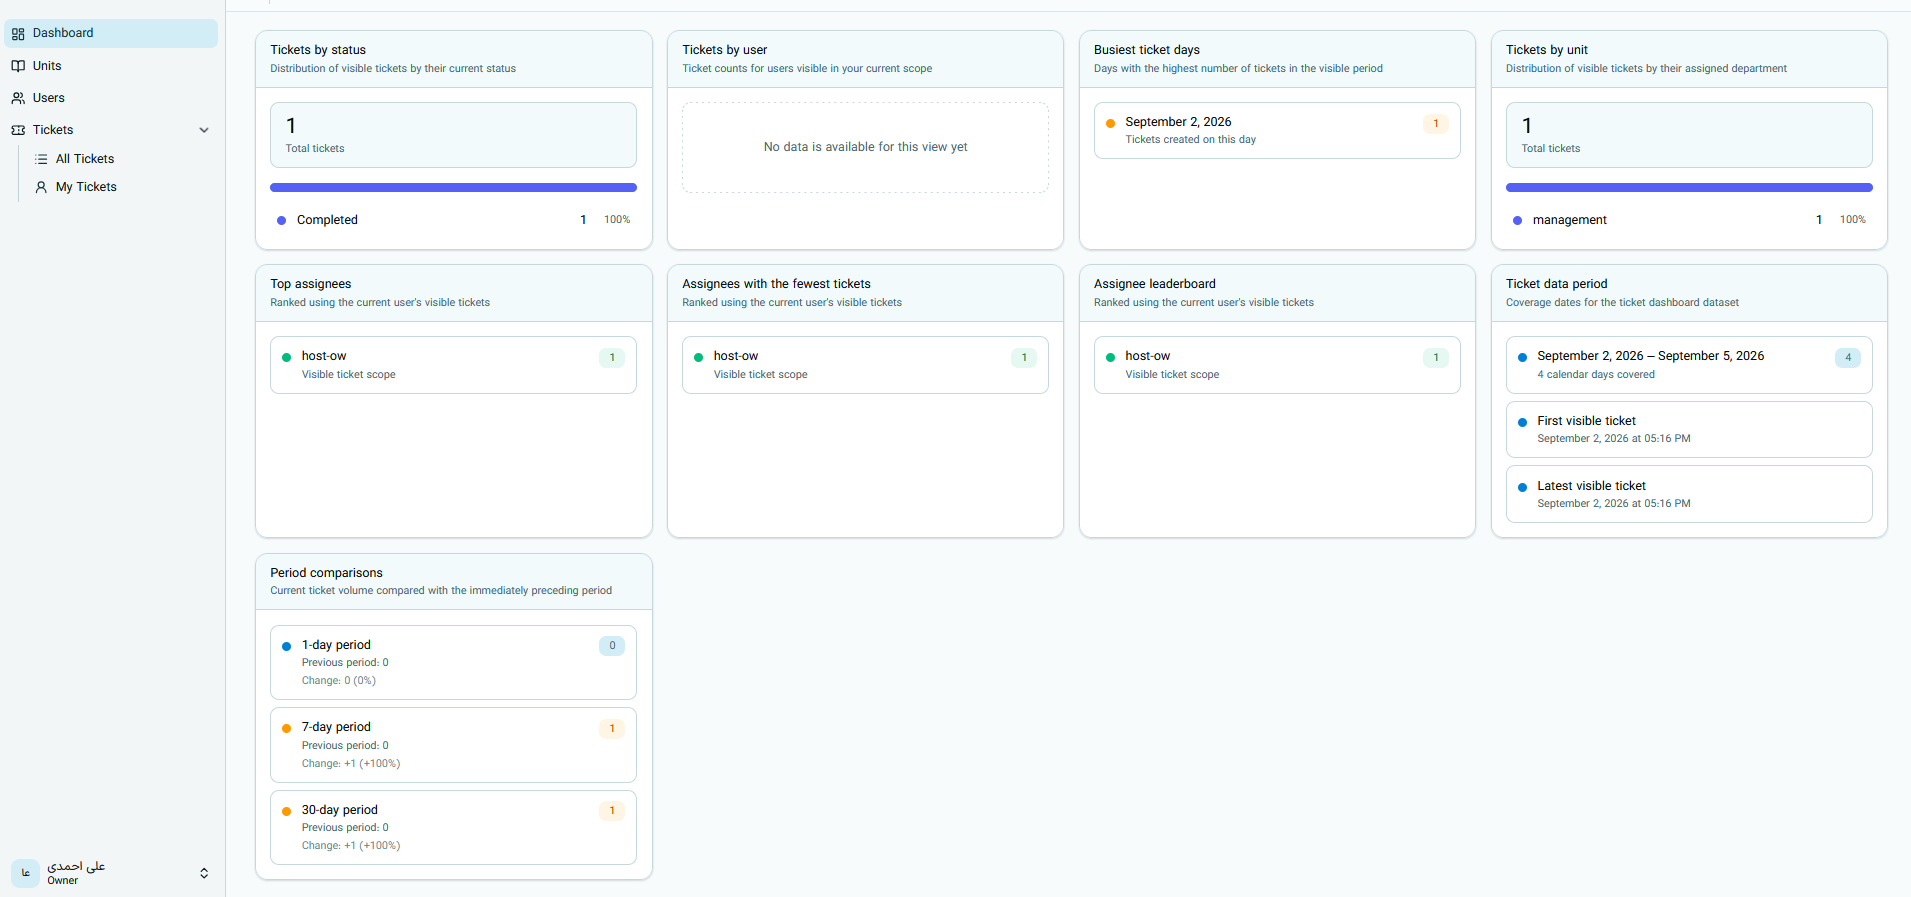
This section displays the count and percentage of tickets broken down by status; for example:
- New: A responsible specialist has not yet been assigned to the ticket.
- Waiting on agent: Further handling is with the support team.
- Waiting on client: The specialist is waiting for the user to respond to continue.
- Completed: Ticket handling has concluded.
The sum of the counts in this section equals the total number of tickets in the same statistical scope.
Busiest Ticket Days
The days on which the highest number of tickets were created are displayed in this section. The number next to each date represents the number of tickets created on that day.
Tickets by Unit
This chart shows the number and percentage of tickets broken down by responsible unit. You can use this section to identify which unit has the highest volume of requests.
Units that have no tickets in the selected period are not displayed in this list.
Top Specialists
The specialist or specialists with the highest number of assigned tickets.
Specialists with the Fewest Tickets
This section shows the specialists who have the lowest number of assigned tickets among specialists with tickets.
Specialist Ranking Table
In the ranking table, specialists are sorted by the number of assigned tickets. The number next to each specialist's name represents their ticket count in the selected period.
Ticket Data Range
This card displays time-related information about the available data:
- Statistical period start
- Statistical period end
- Period length in calendar days
- Creation time of the first ticket in the range
- Creation time of the last ticket in the range
The main ticket dashboard statistics focus on tickets created in the last 30 days and within the user's access scope.
If the first visible ticket was created later than the start of this range, the period length is calculated from the date of that first ticket until today.
Period Comparison
In the Period Comparison section, you can compare the number of tickets in the current period with the period before it.
For each period, the current count, previous period count, and percentage change are displayed.
If there were no tickets in the previous period, the growth percentage may be displayed as full or unlimited growth.
Important Notes About Statistics
- All numbers are based on the current user's access level.
- Tickets without a specialist are counted as "unassigned".
- Only specialists with tickets are included in specialist averages and rankings.
- Changing the period filter can change the numbers and charts.
- To view the latest information, use the Refresh button.
- This dashboard is for viewing and analysis and does not directly change ticket status.
Continue the Guide
- Ticket Dashboard — current page
- User Dashboard
- Unit Dashboard
Next guide: User Dashboard